Data visualisation
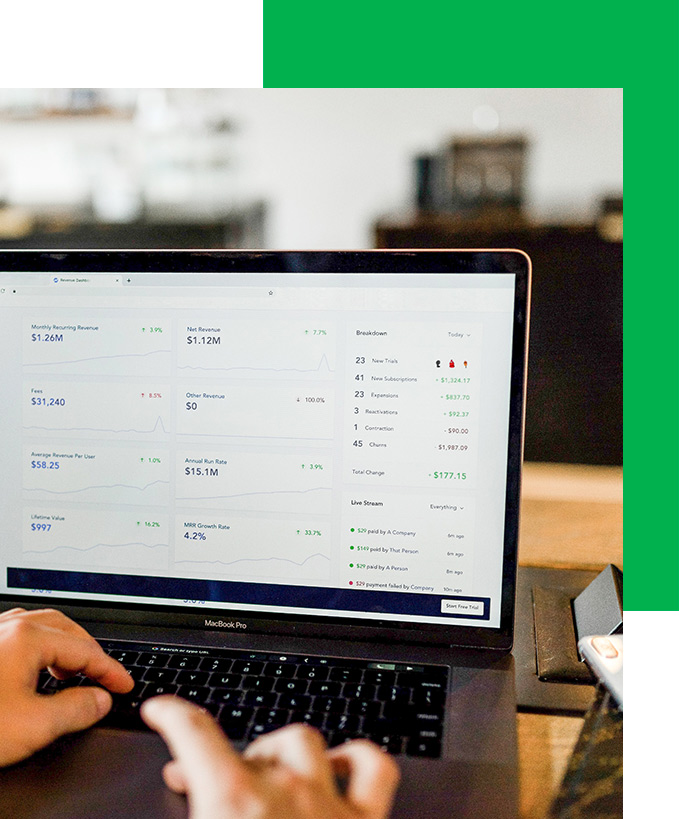
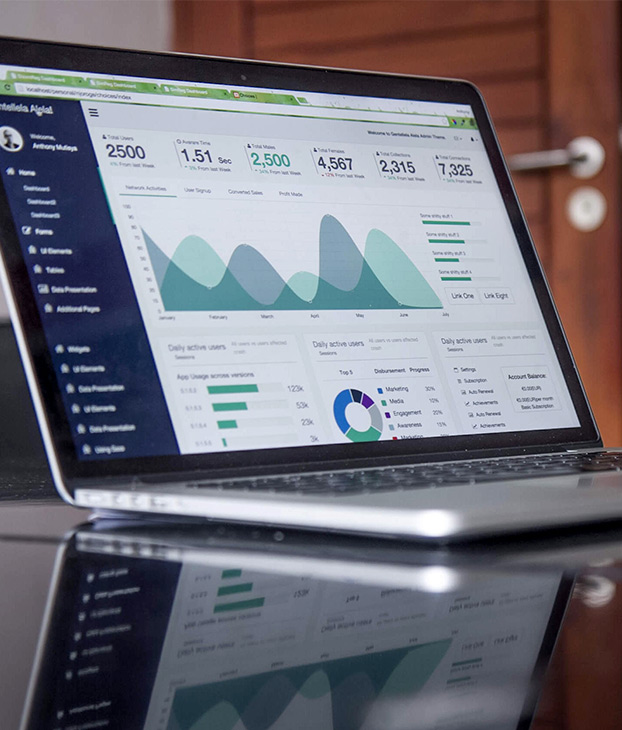
Creation of custom, comprehensive media campaign dashboards. Our data visualization experts will allow you to better manage your media activities.
Mediamix offers its expertise in data visualization in order to build tools adapted to the management of media campaigns. Reconciling campaign data and conversion data, they offer a complete view of media investments and their performance.
The data connectors allow us to retrieve information from advertising platforms as well as from web analytics tools (GA4 in particular).


Data visualization is applicable to multiple domains. At Mediamix, our services are specifically tailored to media campaigns.
- We build interactive reports that combine all media activity and website traffic. By harmonizing performance indicators across platforms, these reports provide a unified understanding of the performance of each channel (programmatic, social networks, DOOH, connected TV, etc.).
- Campaign dashboards also make information easily accessible to advertisers and media traders. They are an indispensable daily work tool and serve the client-agency relationship.
- The processed and reported data gives us access to a global and granular overview of campaign performance.
Dashboard creation
Creating your dashboards with Mediamix is the assurance of having the support of media experts throughout your campaigns.
- The dashboards are custom-made for each of our clients. Based on your activities, we define with you the structure adapted to your campaigns, as well as the desired indicators (KPIs). Whether it's for campaigns focused on traffic generation, conversions, specific filters to be integrated, etc,
- Our data visualization teams then work on a mock-up to define the rendering.
- Once the mock-up is validated, our teams proceed with the connection of the data sources and verify their integrity.


